
Customer Intelligence Is an Architecture Problem

Most enterprises treat customer feedback as a reporting problem. They collect data from support tickets, escalations, product telemetry, and sales interactions, then generate dashboards that tell them what happened last quarter.
This is backwards.
Customer intelligence isn't about looking backward at aggregated metrics. It's about building a system architecture that transforms fragmented signals into coordinated action, in near real-time, across every function that touches the customer. The difference between enterprises that improve customer experience systematically and those that react to complaints is architectural.
The Core Problem: Data Silos Create Blind Spots
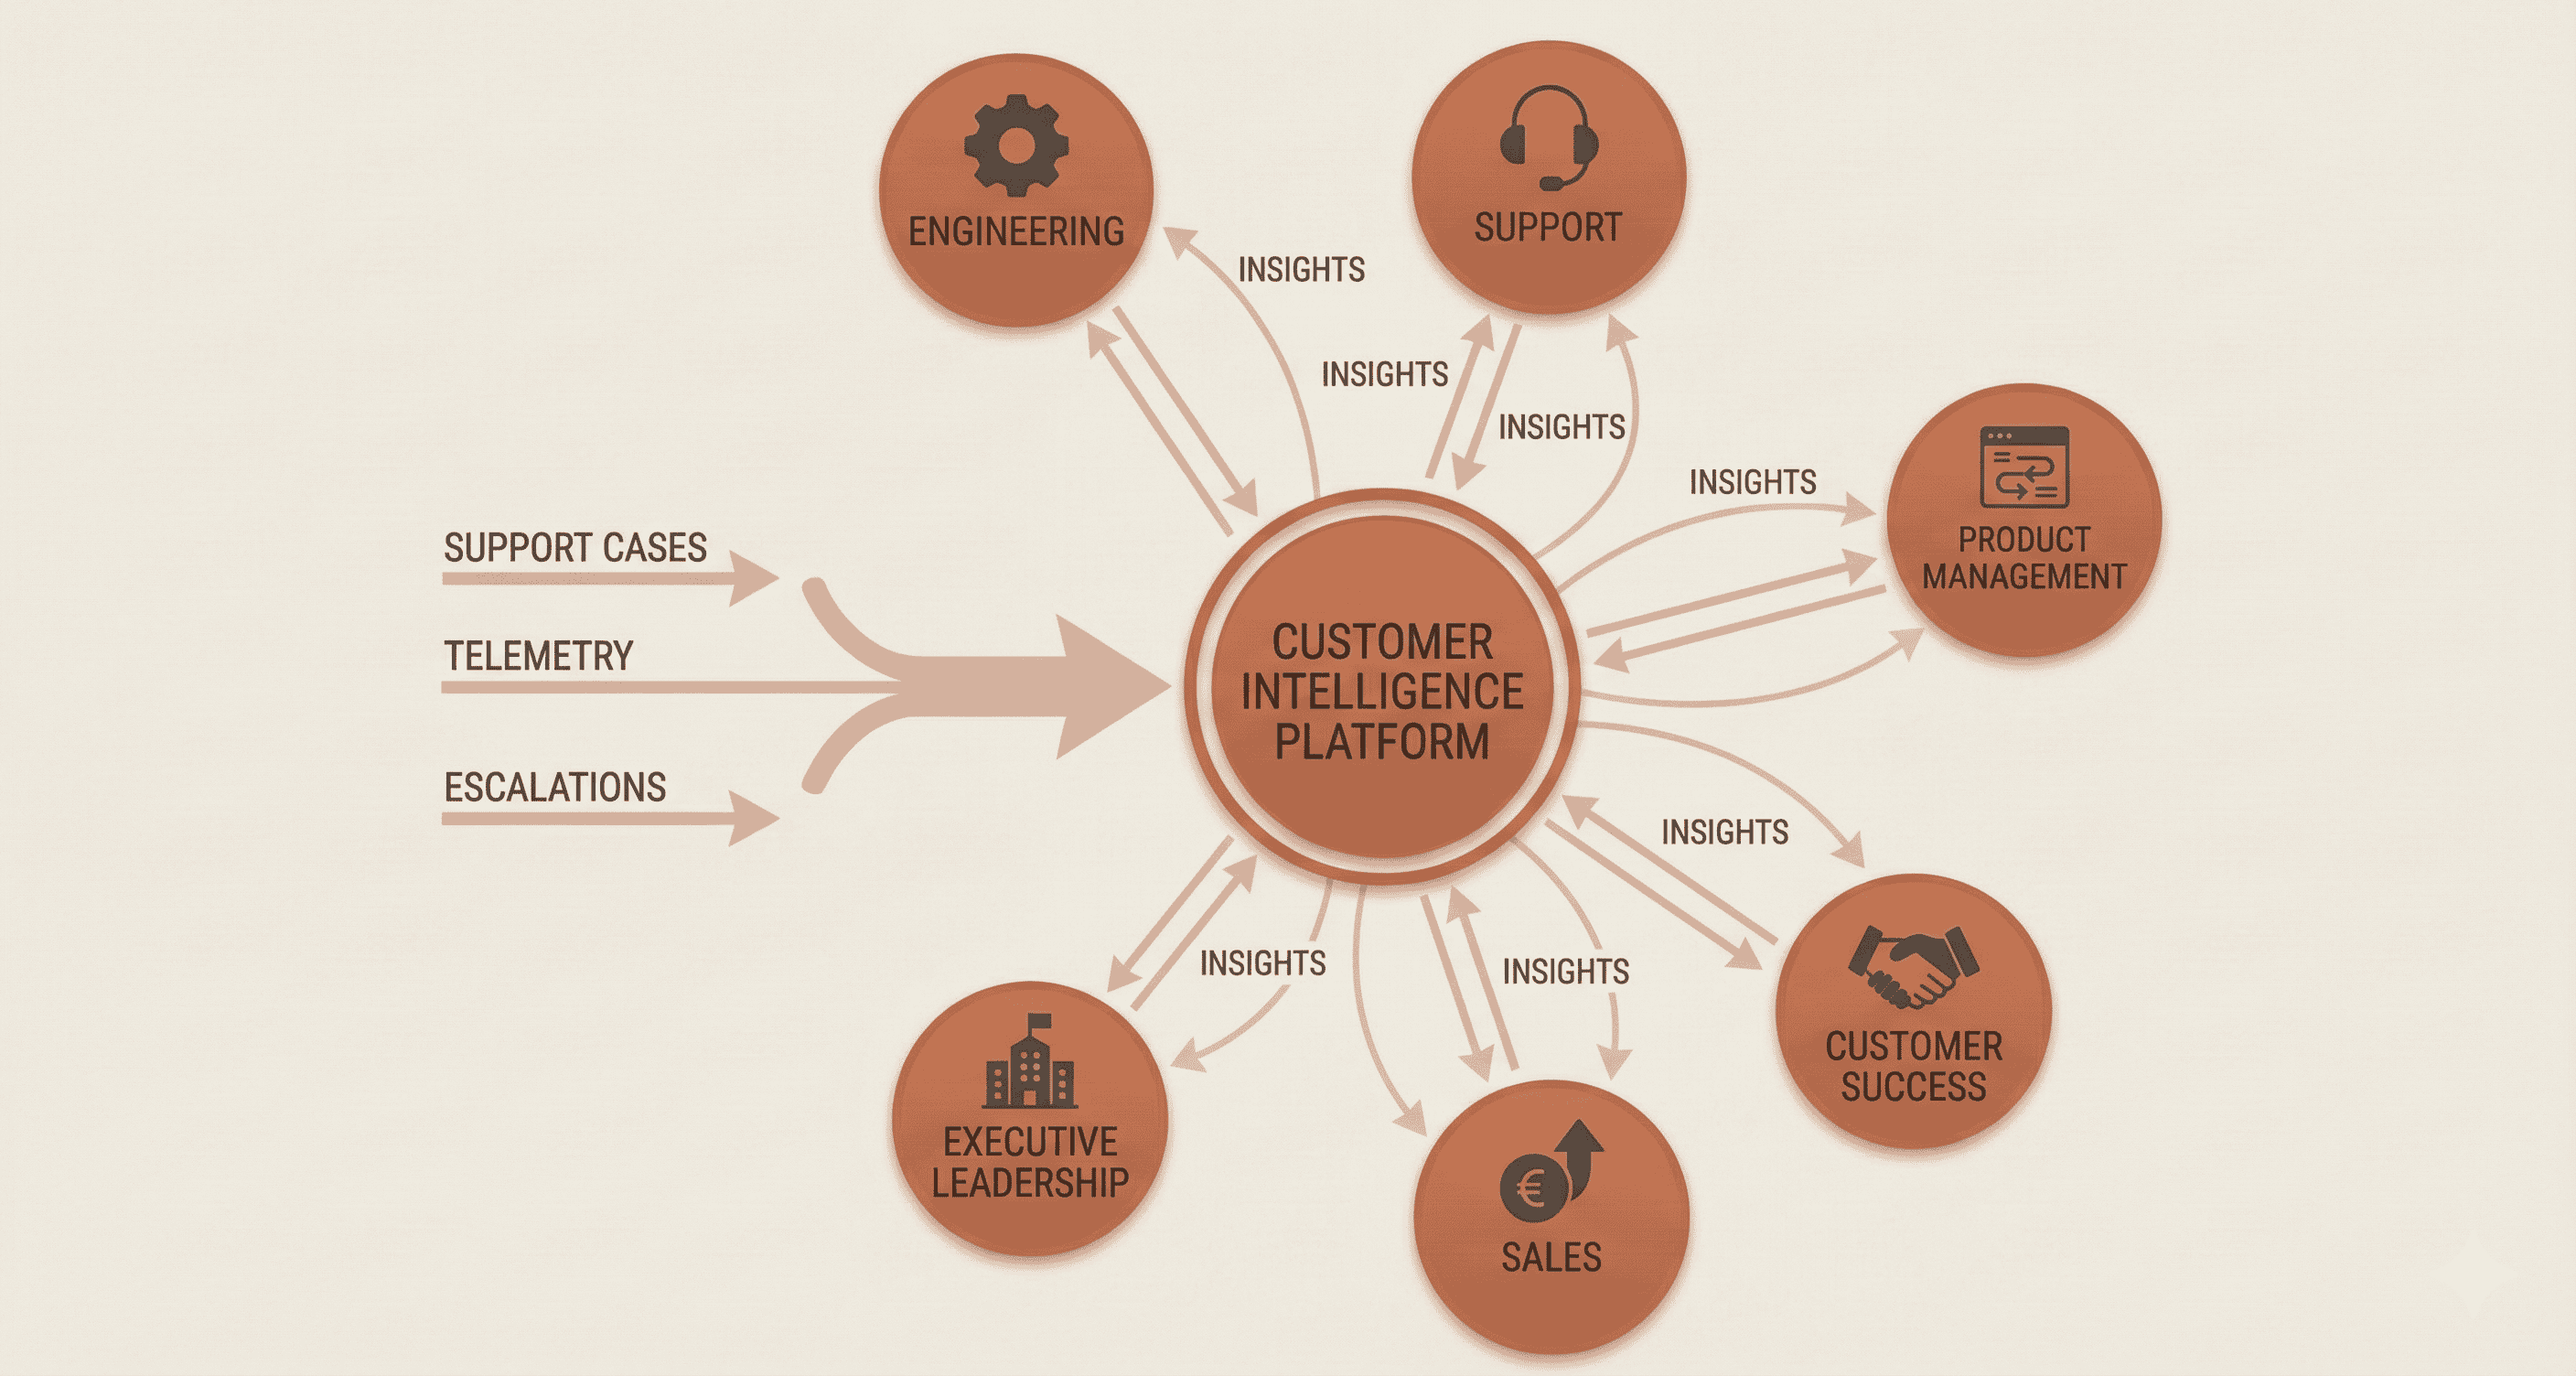
In large organizations, customer data lives in many places. Support cases in one system. Escalations in another. Product telemetry in a third. Sales feedback in spreadsheets. NPS scores in a survey tool. Each team builds its own dashboards, defines its own metrics, and draws its own conclusions.
The result is predictable:
- No unified view of customer pain points. Engineering sees defects. Support sees case volumes. Sales sees churn risk. Nobody sees the complete picture.
- Survivorship bias in prioritization. The loudest problems get attention, not the most impactful ones.
- Manual, error-prone analysis. Teams spend hours correlating data across systems before every quarterly review.
- Reactive decision-making. By the time trends surface, they've already affected hundreds of customers.
The architectural challenge isn't collecting more data. It's building a pipeline that transforms unstructured interactions into structured, actionable intelligence that flows to the right stakeholders automatically.
The Architecture: A Data-to-Insights-to-Actions Funnel
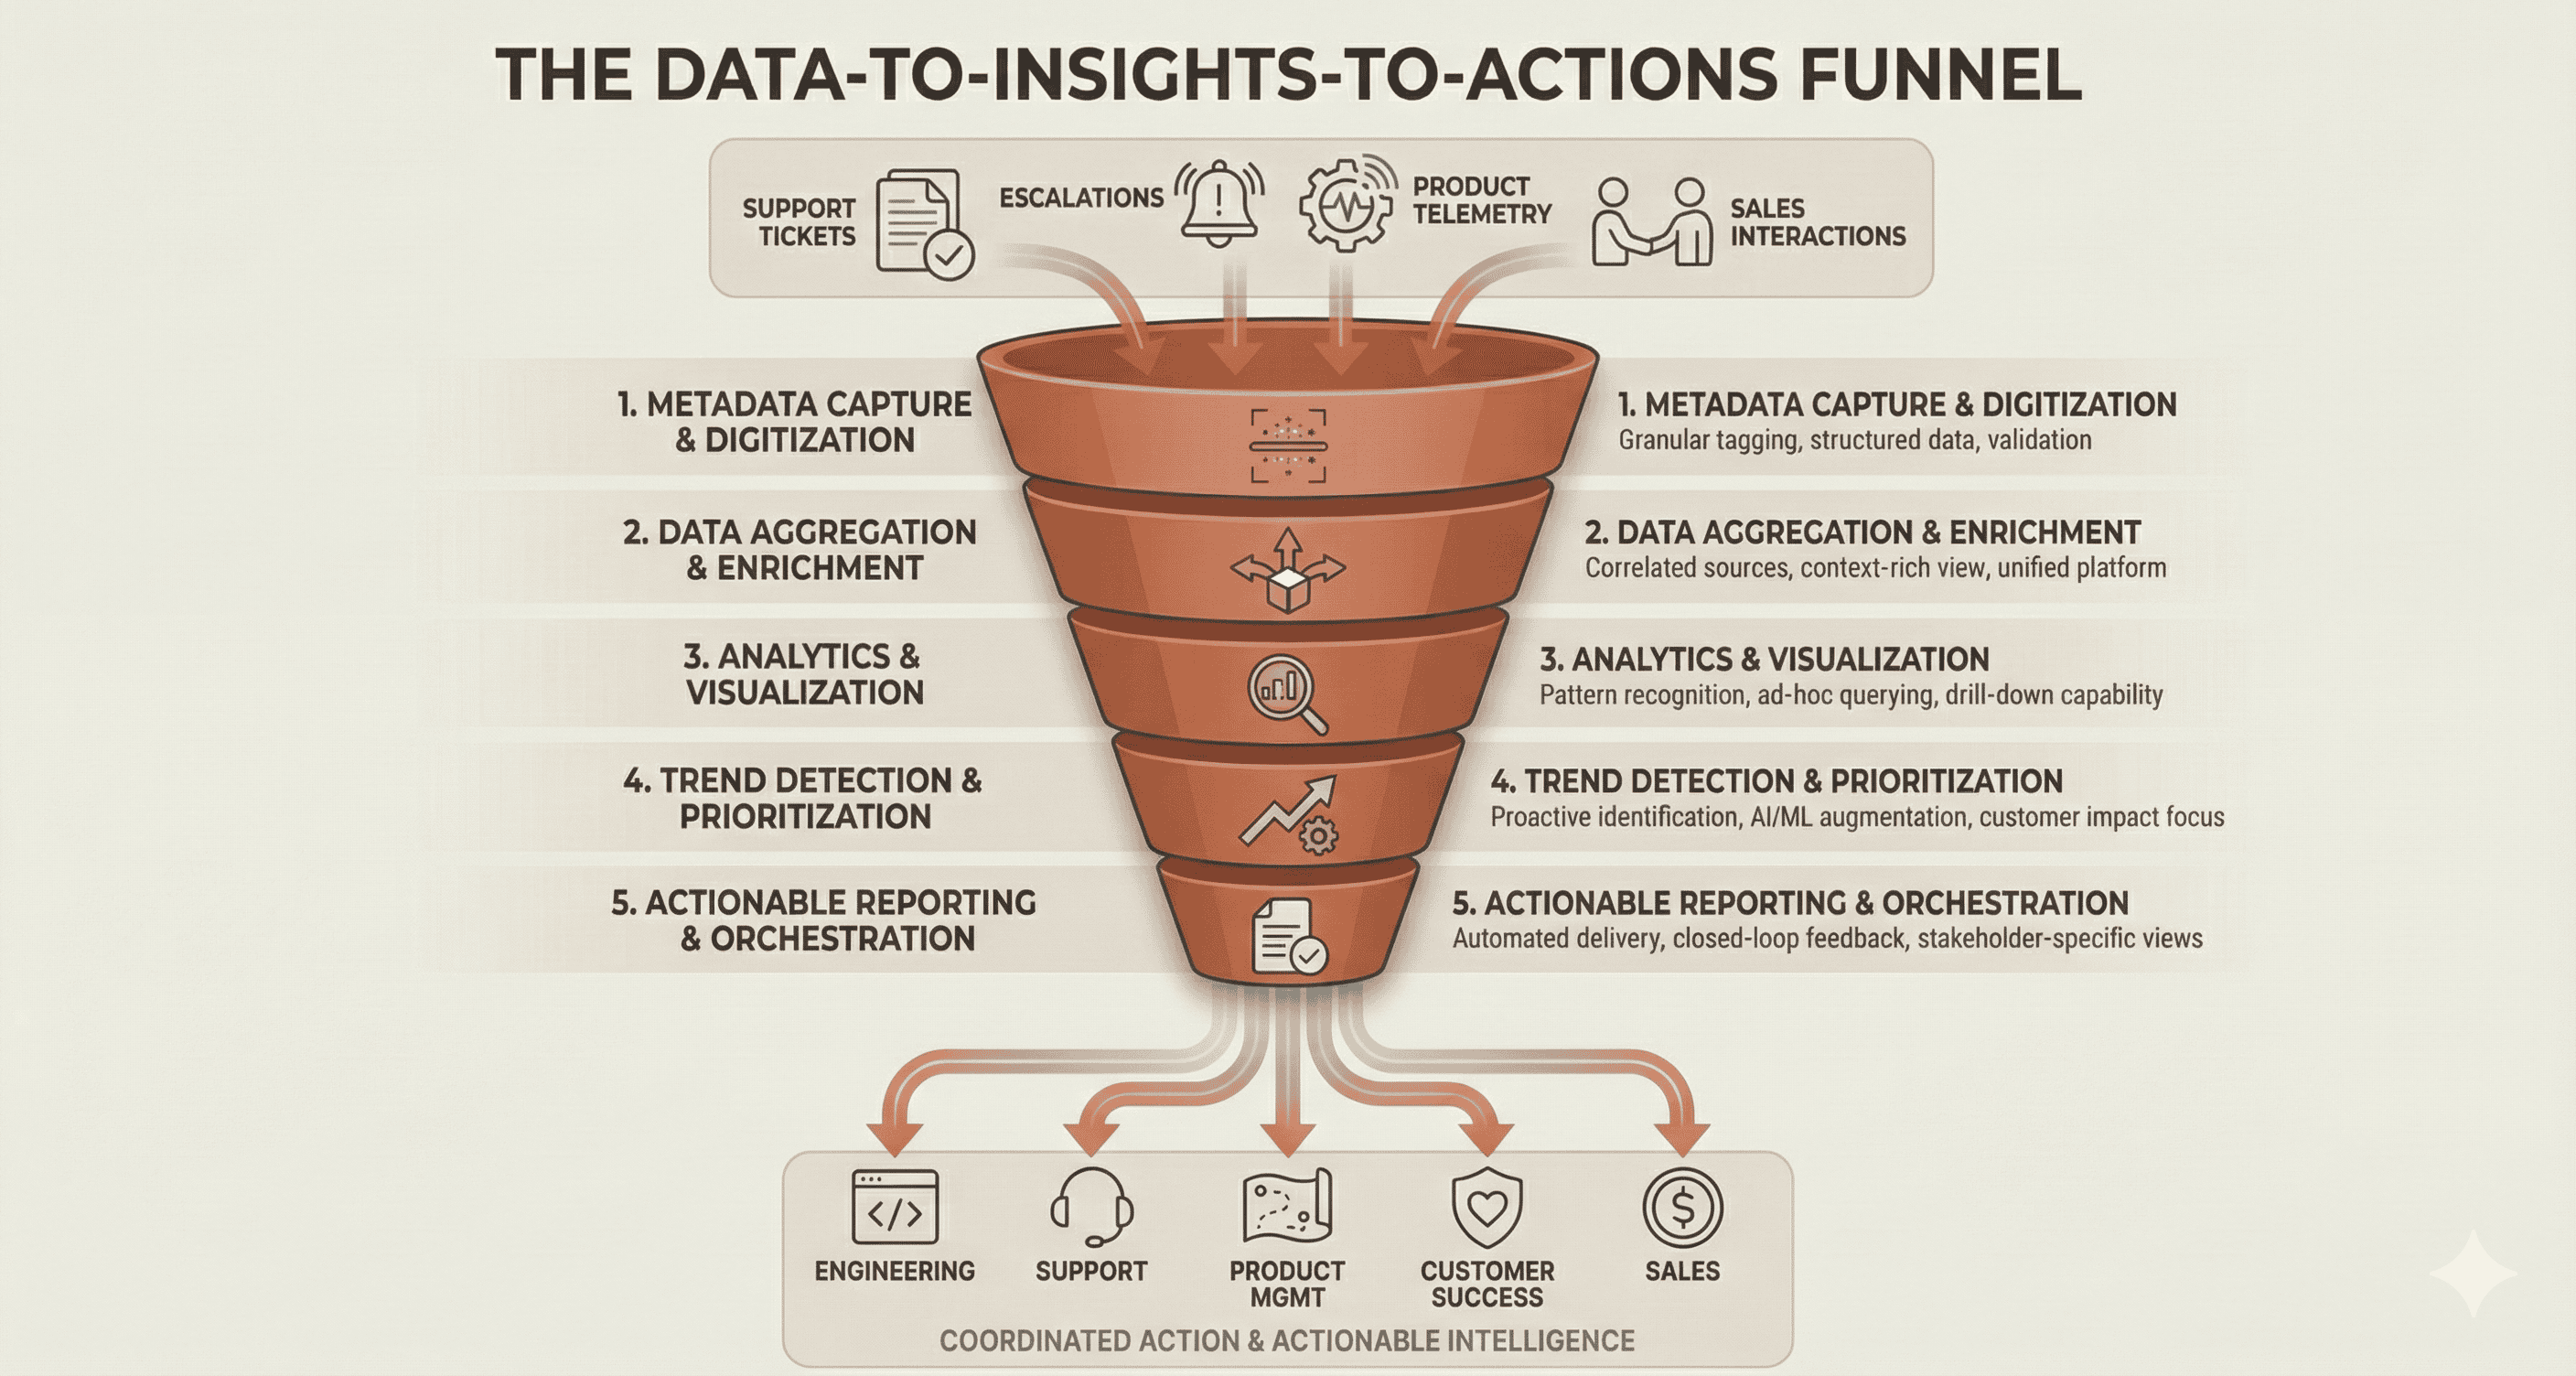
The pattern that works follows a clear progression through five layers:
Layer 1: Metadata Capture and Digitization
Every customer interaction contains signal, but most of it stays unstructured. A support case includes a problem code and resolution summary, but these categories are too broad to identify specific product issues.
The first architectural layer digitizes interactions at a granular level. Instead of categorizing a case as "connectivity issue," the system captures specific metadata: which product component, which integration, which software version, which customer segment.
This requires:
- A tagging or labeling taxonomy specific to your product portfolio
- Integration with case management systems at the point of interaction
- Validation workflows to ensure data quality
- ML/AI augmentation to suggest or auto-populate classifications over time
The depth of your downstream analytics is bounded by the granularity of this capture layer. Broad categories yield broad insights. Granular metadata enables precise root cause analysis.
Layer 2: Data Aggregation and Enrichment
Raw metadata from customer interactions becomes valuable when correlated with data from other systems. A support case about a connectivity problem means more when enriched with:
- Customer contract and entitlement data
- Product telemetry showing error patterns
- Defect tracking system status
- Historical case patterns for this customer
- Escalation history
This layer serves as the data concentrator, pulling from disparate sources via APIs and consolidating into a unified repository. The technical implementation typically involves:
- A big data platform capable of handling millions of records
- RESTful API connectors to upstream systems
- Data normalization and deduplication logic
- A schema flexible enough to accommodate new data sources
The output is a correlated view of each customer interaction, enriched with context that no single source system contains.
Layer 3: Analytics and Visualization
With enriched data in a centralized repository, the next layer enables exploration and pattern recognition. This is where Elasticsearch/Kibana stacks, Snowflake, or similar platforms provide:
- Ad-hoc querying across millions of records
- Pre-built dashboards for common KPIs
- Drill-down capability from portfolio-level trends to individual cases
- Correlation analysis across previously siloed data dimensions
The key design principle: don't just replicate existing reports in a new tool. Enable analysis that was impossible before. Can you now correlate case volume spikes with specific software releases? Can you identify which third-party integrations generate the most support friction? Can you see which customer segments experience the highest escalation rates?
If your analytics layer only answers the same questions your old dashboards answered, you've built expensive infrastructure without new capability.
Layer 4: Trend Detection and Prioritization
Pattern recognition at scale requires automation. The trend detection layer monitors the data stream for:
- Emerging issues: Problems that are growing faster than baseline
- Anomalies: Sudden spikes in specific categories
- Cross-dimensional patterns: Issues that correlate across product lines, customer segments, or regions
This layer transforms analytics from reactive (someone queries the data) to proactive (the system surfaces what matters).
The prioritization component is equally important. Large organizations generate hundreds of potential serviceability items per month. Without intelligent prioritization, teams drown in backlog. Effective prioritization considers:
- Customer impact (how many affected, severity of impact)
- Trend trajectory (growing, stable, or declining)
- Addressability (can we actually fix this?)
- Strategic alignment (does this serve key customers or growth segments?)
Automation here doesn't replace human judgment. It surfaces the top candidates so humans can focus on decisions rather than data wrangling.
Layer 5: Actionable Reporting and Orchestration
The final layer closes the loop by delivering insights to stakeholders in formats they can act on.
Different stakeholders need different views:
- Engineering needs defect patterns, top case generators, and feature request data to inform roadmap decisions
- Support leadership needs case volume trends, escalation patterns, and training gap indicators
- Product management needs customer pain point prioritization and competitive friction analysis
- Customer success needs account-specific risk indicators and adoption barriers
- Sales needs upsell opportunities and cross-sell positioning based on support patterns
A well-designed orchestration layer:
- Generates stakeholder-specific reports on a cadence (weekly, monthly, quarterly)
- Routes actionable items to appropriate systems (ticketing, roadmap tools, training platforms)
- Tracks completion and impact of resolved items
- Creates a feedback loop that improves prioritization over time
Architectural Principles That Matter
Build for Cross-Functional Consumption
The architecture fails if only one team uses it. Design from the start for multiple stakeholders with different needs. This means:
- Flexible reporting that accommodates different views
- Access controls that allow appropriate visibility
- Common definitions and taxonomies across functions
- Clear ownership of data quality at each layer
Invest in the Capture Layer
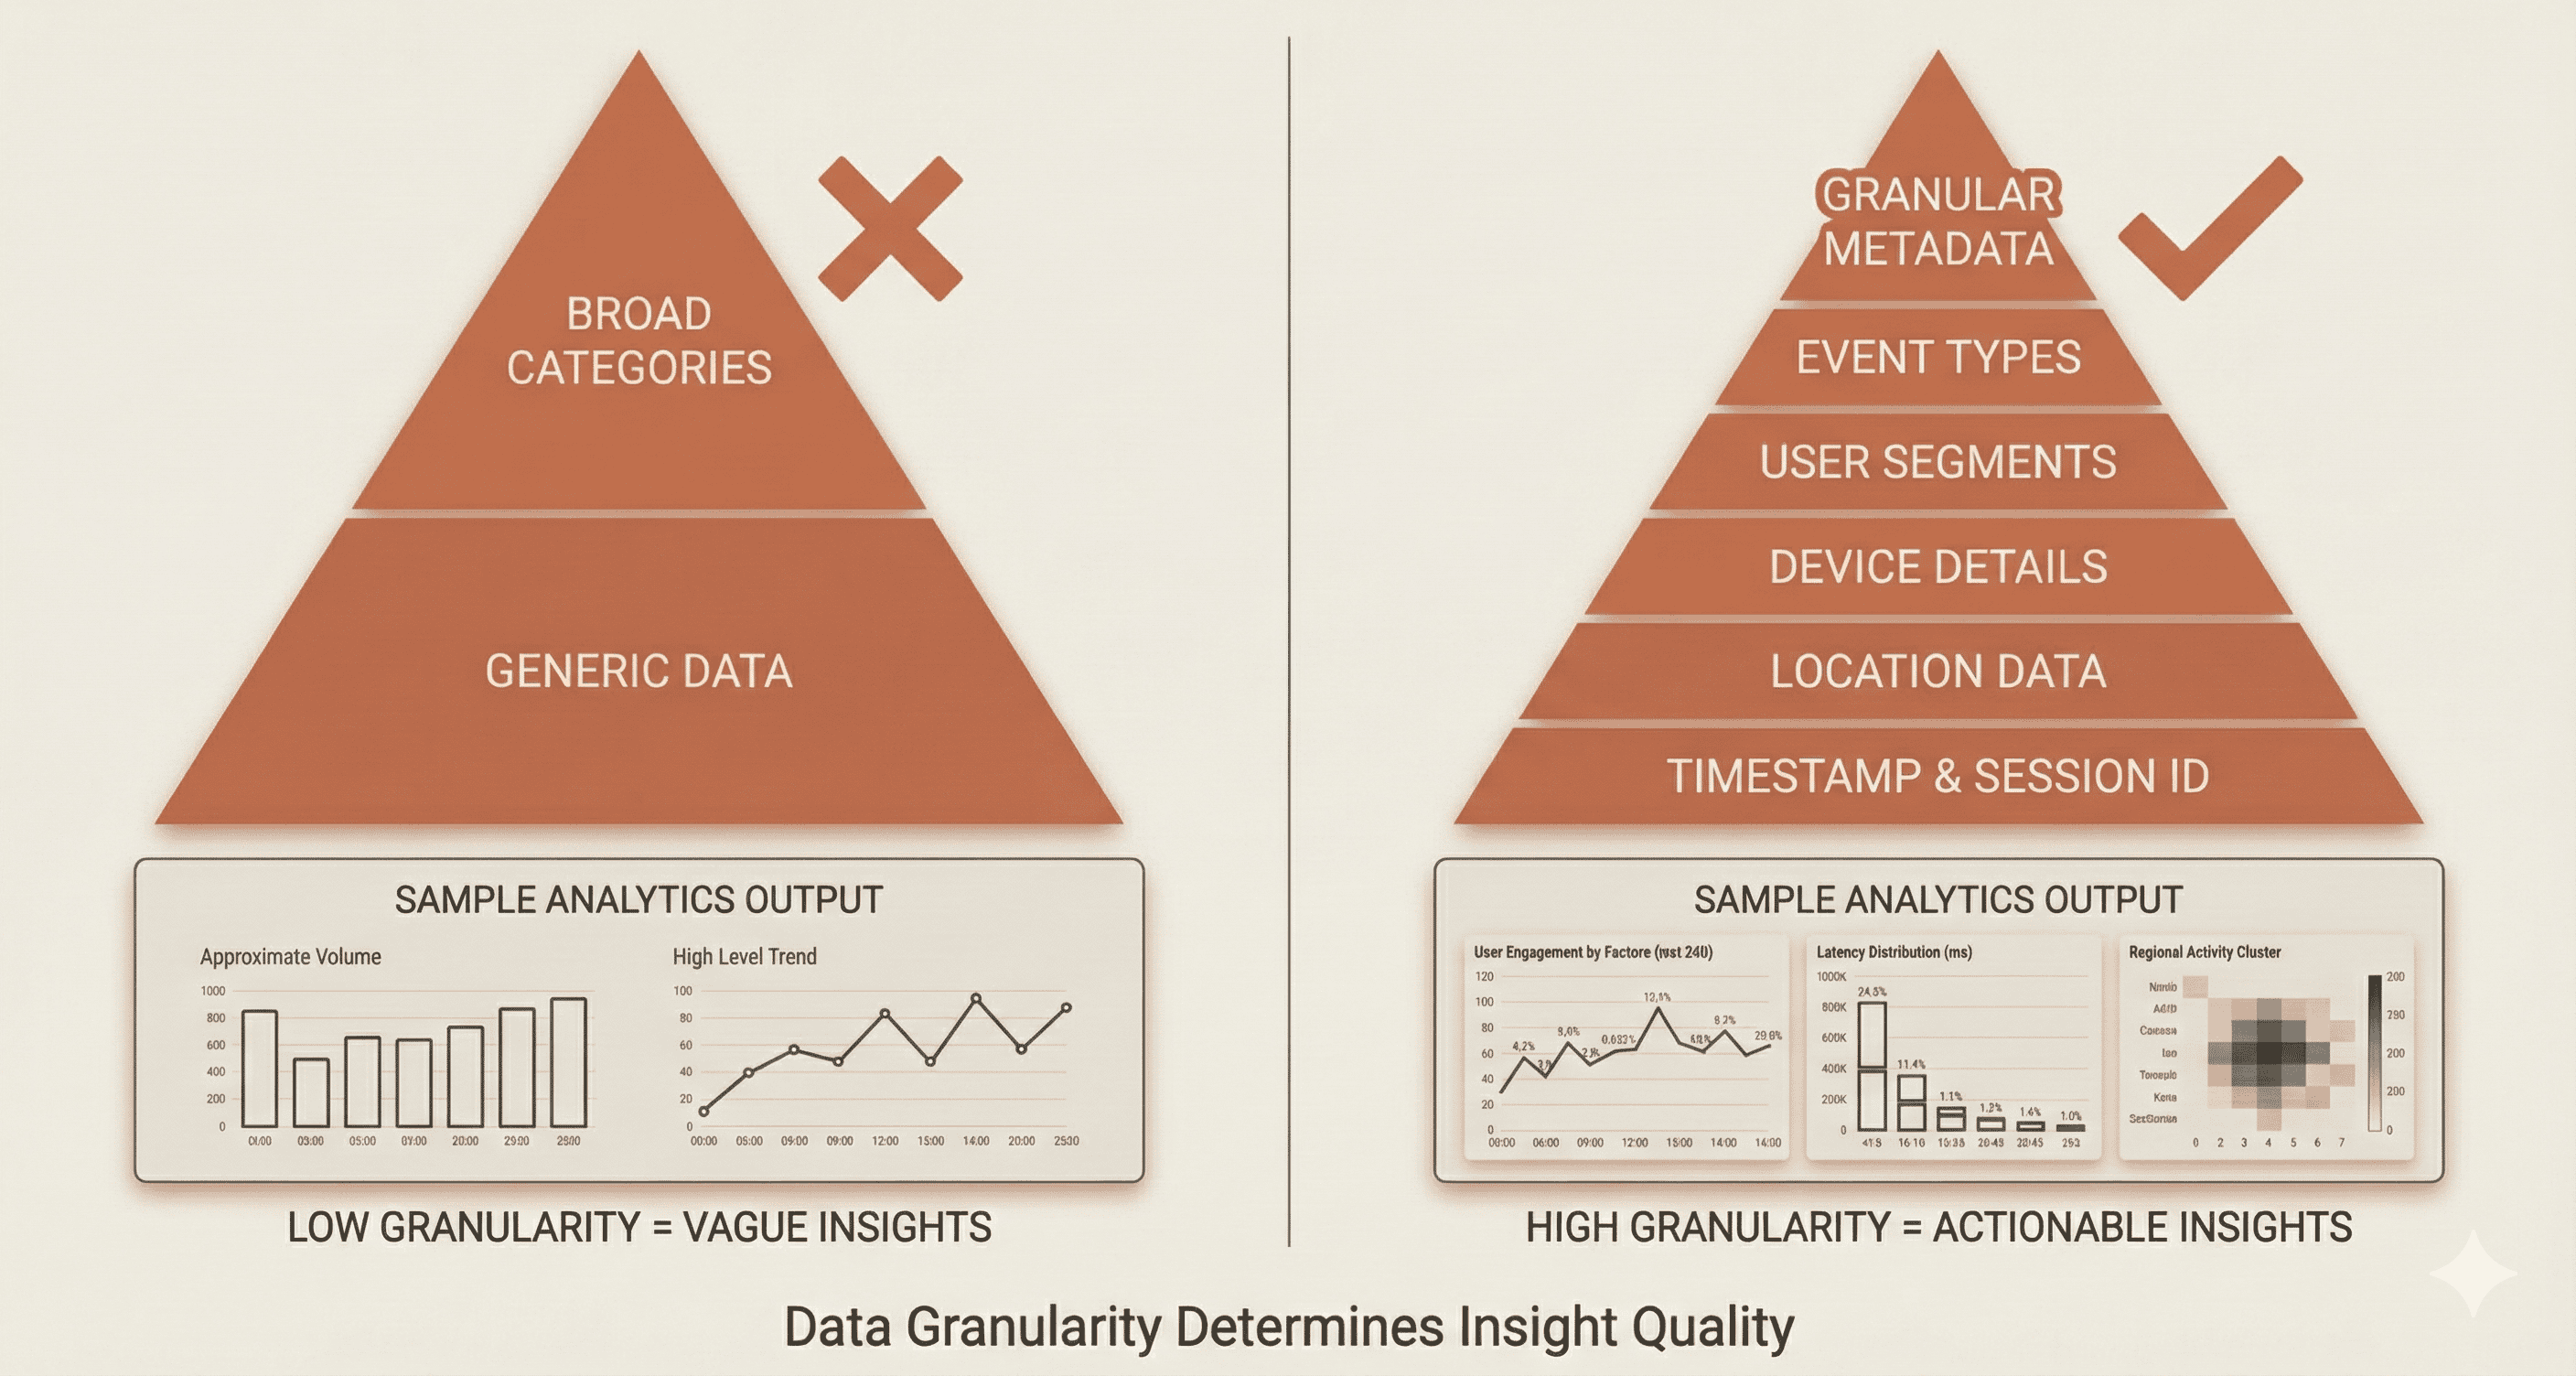
Organizations consistently underinvest in Layer 1 (metadata capture) and overinvest in Layer 3 (analytics dashboards). The math is simple: if your source data lacks granularity, no amount of analytics sophistication compensates.
A rigorous capture layer with consistent taxonomy across products and regions provides more value than a fancy visualization tool built on inconsistent data.
Design for Continuous Improvement
Customer intelligence isn't a project with an end date. The architecture should support:
- Adding new data sources as systems evolve
- Refining taxonomies as products change
- Improving ML classification accuracy over time
- Expanding stakeholder coverage as adoption grows
Build iteration into the operating model, not just the technology.
Where This Architecture Has Limits
This pattern works best in organizations with:
- High interaction volume. The ROI on infrastructure investment scales with data volume. A company handling millions of customer interactions annually sees different returns than one handling thousands.
- Product complexity. Simple products with straightforward support don't need eight-level-deep categorization taxonomies.
- Cross-functional alignment. The architecture delivers value only if multiple functions consume and act on the insights. In siloed organizations, the data concentrator just becomes another silo.
It also requires sustained investment. The capture layer needs ongoing taxonomy maintenance. The aggregation layer needs API updates as source systems change. The analytics layer needs new dashboards as business questions evolve. This isn't a "build once, run forever" system.
Real-World Implementation
This architectural pattern has proven effective at scale. Cisco's implementation, which they call the TRON Framework, won a Gold Stevie Award in the 2024 Stevie Awards for Sales and Customer Service. Their system processes millions of customer interactions annually across a portfolio spanning hundreds of products, delivering actionable insights to engineering, support, sales, and customer success teams through a unified big data platform.
The recognition validates the pattern's effectiveness, but more importantly, it demonstrates that the architecture can work in complex, global enterprises with fragmented data ecosystems.
The Investment Calculus
Building this architecture requires significant investment in platform infrastructure, data engineering, and cross-functional alignment. The question isn't whether the pattern is sound. It's whether your organization has the scale, complexity, and cross-functional maturity to realize returns.
For enterprises struggling with fragmented customer data, reactive decision-making, and siloed insights, the architectural approach outlined here provides a roadmap. The layers are clear. The principles are proven. The remaining question is execution.